
Creating effective Looker Studio dashboards is an art and a science. It involves blending data visualization with business intelligence. Looker Studio is a powerful tool for crafting interactive, customizable, and user-friendly dashboards.
They provide clear insights at a glance, making data analysis more accessible. With Looker Studio, you can integrate multiple data sources seamlessly. This guide will walk you through creating impactful dashboards, complete with step-by-step instructions and inspiring examples. Let's dive into the world of Looker Studio dashboards.
What is Looker Studio? An Overview
Looker Studio is a cutting-edge platform for data professionals that allows users to create insightful data visualizations effortlessly. This tool is part of the Google Cloud suite and excels in business intelligence. Its intuitive design makes data accessible to everyone in an organization.
Users can harness a variety of data sources, a flexibility crucial for generating comprehensive insights. Key features of Looker Studio include:
- A user-friendly, drag-and-drop interface
- Seamless integration with numerous data sources
- Real-time data updates for current analytics
- Advanced collaboration tools for teamwork
In essence, Looker Studio transforms raw data into a meaningful story. It is an invaluable tool for any data-driven organization.
Why Use Looker Studio Dashboards?
Looker Studio dashboards stand out for their intuitive design. They transform complex data into visual stories, offering clarity at a glance. This capability aids in quicker decision-making and strategy development.
A significant advantage is their customizable nature. Users can tailor dashboards to fit specific business needs and metrics. Key benefits include:
- Interactive visualizations that engage users
- Seamless data integration from multiple sources
- Real-time updates ensuring the freshest data
- Customization options for personalized analytics
Moreover, Looker Studio encourages collaboration. Its sharing capabilities and security features foster teamwork while safeguarding sensitive information, turning data into a tool for growth and innovation.
Key Features of Looker Studio
Looker Studio offers a plethora of features designed to enhance data visualization. One standout feature is its drag-and-drop interface. Another hallmark is its comprehensive data integration capabilities. The customization options are impressive, allowing dashboards that align with branding and improve functionality.
Key features include:
- Real-time data updates for accuracy
- Advanced data blending capabilities
- Conditional formatting for emphasis
- A mobile-friendly design for accessibility
- Scheduling features for automated reporting
With robust access controls, users can confidently share dashboards with stakeholders, ensuring data privacy is maintained.
Planning Your Looker Studio Dashboard
Before diving into Looker Studio, careful planning is essential. A well-thought-out plan leads to a more effective dashboard. Start by identifying the primary goal and understanding your audience. Tailor the design to fit their requirements, focusing on metrics and visuals that provide value.
To organize your thoughts, consider:
- Dashboard objectives and goals
- Audience needs and preferences
- Key metrics to be displayed
- Required data sources
- Overall visual theme
A consistent layout with intuitive navigation helps users find information quickly. Avoid clutter by focusing on essential data and maintaining a clean aesthetic.
Step-by-Step Guide: Creating a Looker Studio Dashboard
Creating a Looker Studio dashboard involves several key steps. Begin by logging in and starting a new project, then choose and connect your data sources. Once connected, design your dashboard layout using the drag-and-drop features.
Populate the dashboard with visualizations like charts, tables, and maps that best represent your data. Customize colors, themes, and fonts to align with your brand. Finally, test your dashboard for functionality, gather feedback, and share it with your audience.
Here's a quick checklist:
- Log in and start a new project.
- Select and connect data sources.
- Design the dashboard layout.
- Populate with visualizations and customize.
- Test for clarity and functionality.
- Gather feedback and share with stakeholders.
Looker Dashboard Examples for Inspiration
Exploring various Looker dashboard examples can spark creativity and provide a visual demonstration of what’s achievable. Look for dashboards that feature KPIs prominently and have a logical data flow.
Here are a few types of dashboards to explore:
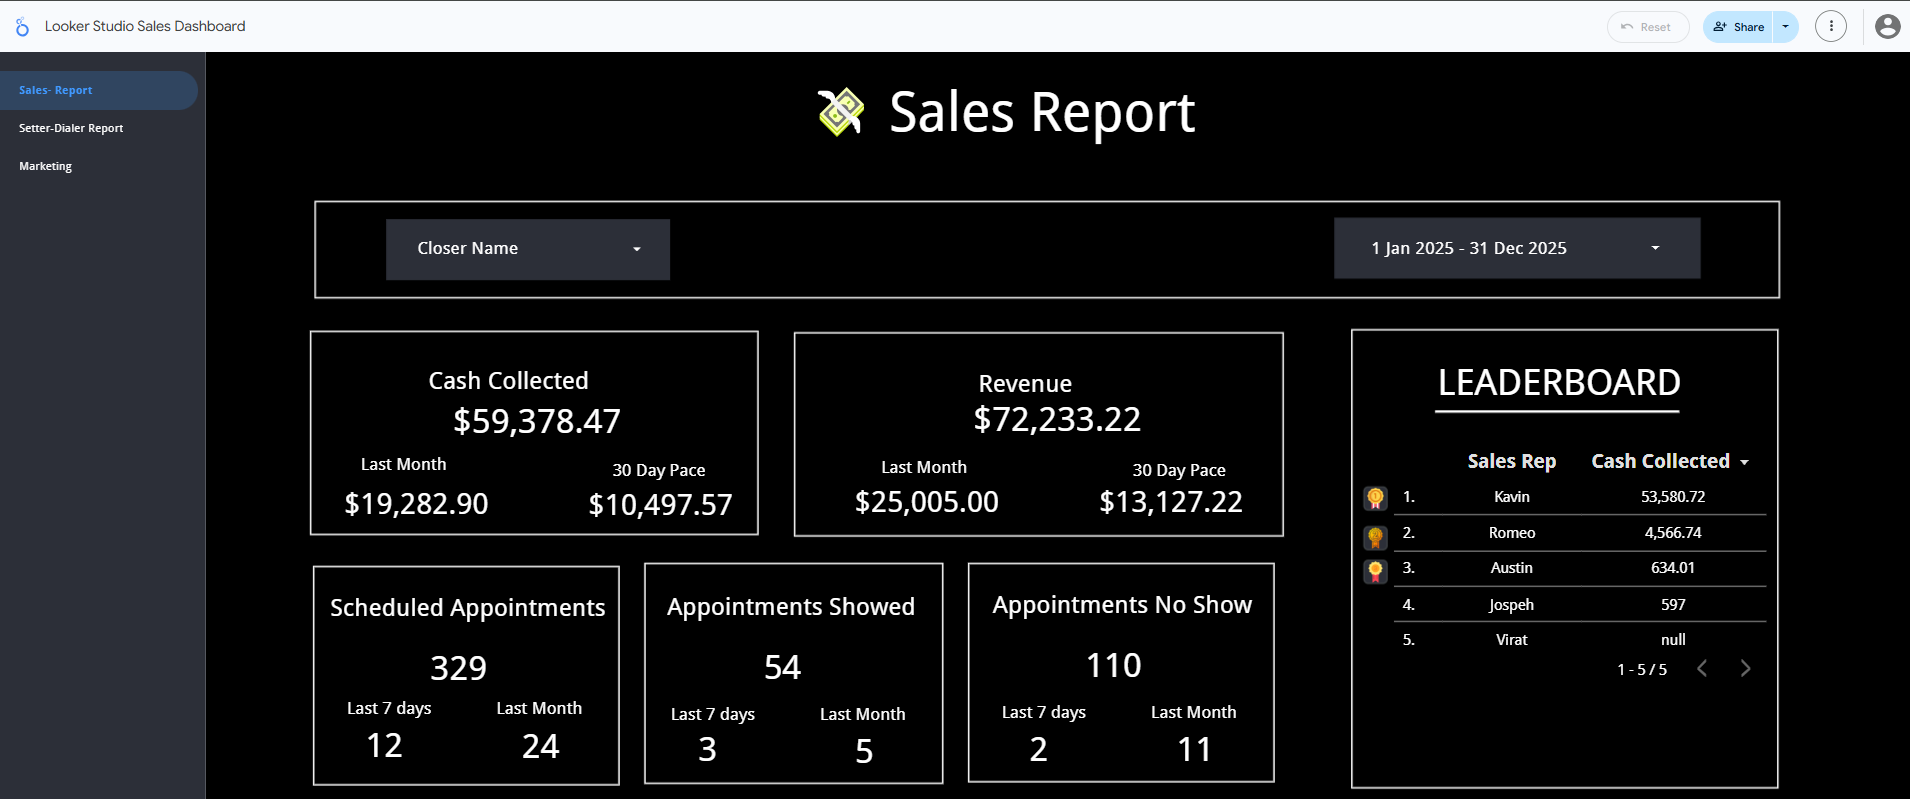
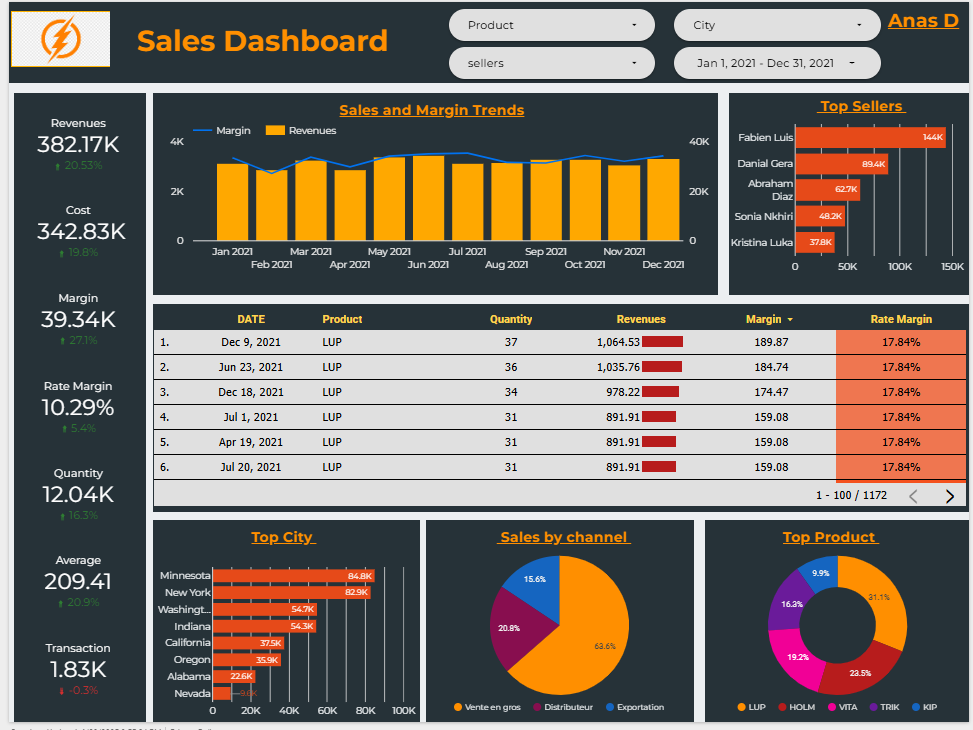
- Sales Performance Dashboard: Tracks sales metrics and trends.
- Marketing Analytics Dashboard: Showcases campaign effectiveness and ROI.
- Financial Overview Dashboard: Summarizes financial health and key metrics.
- Project Management Dashboard: Monitors timelines and resource allocation.
Best Practices for Dashboard Design
Designing an effective dashboard requires prioritizing clarity and usability. Avoid clutter by focusing only on key metrics, and select visuals that best convey your data. Incorporating user feedback is essential for continuous improvement.
Consider the following best practices:
- Consistency: Maintain a unified style and formatting.
- Simplicity: Use clear labels and legends for each visual component.
- Accessibility: Ensure dashboards are viewable on multiple devices.
- Performance: Minimize load times for fast access.
Conclusion
Creating effective Looker Studio dashboards begins with understanding user needs and ends with a tool that drives insights and informs decisions. By integrating best practices, customizing to your audience, and performing regular updates, your dashboards become invaluable assets.
With continuous learning and adaptation, Looker Studio dashboards can become pivotal in achieving your business objectives.